

The maintained reference layer
Exabel Knowledge GraphYour agent can write the code.
Give it knowledge it can trust.
Exabel Knowledge Graph connects identity, meaning and history across your data.
EKG:BRAND:00417
Chipotle
owned by Chipotle Mexican Grill, Inc. · NYSE: CMG
Card spend · Consumer Edge
merchant CHIPOTLE
Foot traffic · Placer.ai
chain 59b031ad…
Mobile app · Sensor Tower
com.chipotle.ordering
Consensus · Visible Alpha
comparable sales growth
Effective 2017-01-01 · Known to Exabel 2026-09-30
The world in fall 2026
Code became abundant. Trusted interoperability did not.
Data already lands in Snowflake. Agents inspect schemas, write SQL and build models. Yet a new alternative dataset can still take months to evaluate, connect and maintain.
“Why does integrating one new dataset still take months?”
Four answers an agent should not invent
Is this the same restaurant, brand, company or security?
A foot-traffic feed says “Chipotle #123”; a card feed says “CHIPOTLE 0123”. The name alone cannot establish the same store.
→ Check location and native identifiers.
Do two provider metrics describe the same economic concept?
Store visits, card spending and reported revenue describe different things — even when all three refer to Chipotle.
→ Keep units, channels and business scope explicit.
Which period does the value describe — and when was it knowable?
A March sales figure is revised on May 10. A backtest dated April 1 must use only the version available then.
→ Preserve the original and revised vintages.
Why should the mapping be trusted, and where can it fail?
Two providers agree on a company mapping, but both copied the same reference feed. Agreement alone is not corroboration.
→ Trace provenance and flag shared sources.
The agent can propose. Production investment use needs maintained answers.
The product and the fund’s workflow
A maintained semantic database for agents and humans.
Fund workspace
Agent
Inspects the provider’s Snowflake share, writes SQL and executes the investment workflow. Fund permissions, models and decisions stay with you.
Exabel Knowledge Graph share
Semantic memory
Maintained identity, meaning, time and evidence across providers: canonical IDs, provider Connections, point-in-time validity.
Client-agnostic by design. Exabel Knowledge Graph does not inspect the trial or run the model; the fund’s agent reuses answers already mapped, tested and maintained.
One ontology. Many maintained Connections.
Transactions & commerce
Physical activity & mobility
Digital commerce & web
Identity
Economic entities
Where
Channels & endpoints
What
Measurement
When
Time & market context
App & mobile
Workforce & surveys
Real assets & supply chain
Forecasts & markets
Provider-native concepts connect through shared identity, measurement and time semantics.
For data vendors · full authoring & assurance target: November 2026
Point your agent at Exabel Knowledge Graph.
Your agent builds the Connection — and keeps it current every day.
“Connect our store dataset to Exabel Knowledge Graph. Follow its instructions to build and test the Connection. Run a daily maintenance job: reconcile new and changed records, preserve history, rerun tests and flag exceptions.”
01 · Start in your environment
Your data. Your agent.
Give your agent your schema, documentation and permitted data access. You retain control.
02 · Follow the instructions
A precise, executable contract
Exabel supplies definitions, mapping recipes, worked examples and tests.
03 · Update & maintain daily
A Connection that stays current
Reconcile new IDs, changed records and schema changes. Publish tested updates with evidence.
At launch · 1 Dec 2026
50+
datafeeds connected
After launch
+1/day
a new vendor every day
Today
34×30
vendors × funds, each integrating separately
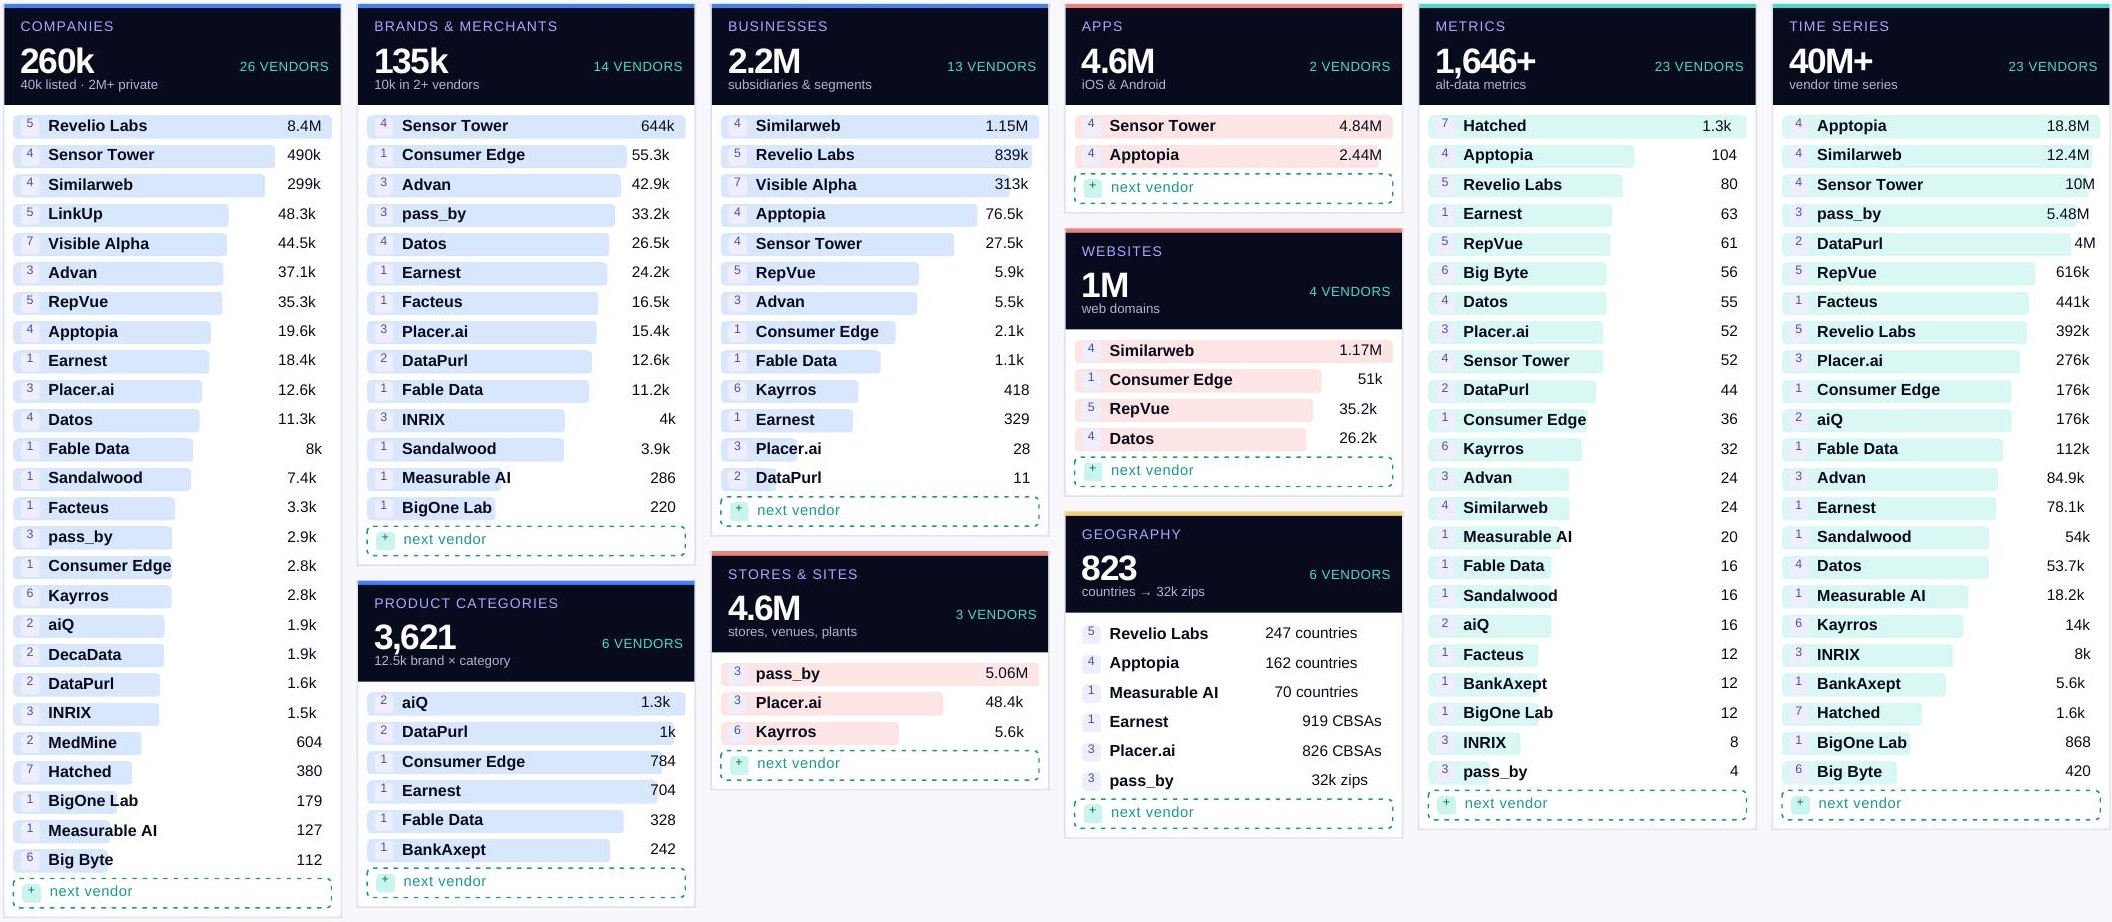
One maintained Connection. Reusable across many customer integrations.
Free Connection authoring · Optional Exabel Assurance and maintenance
CMG comps · Q3 report on 28 October
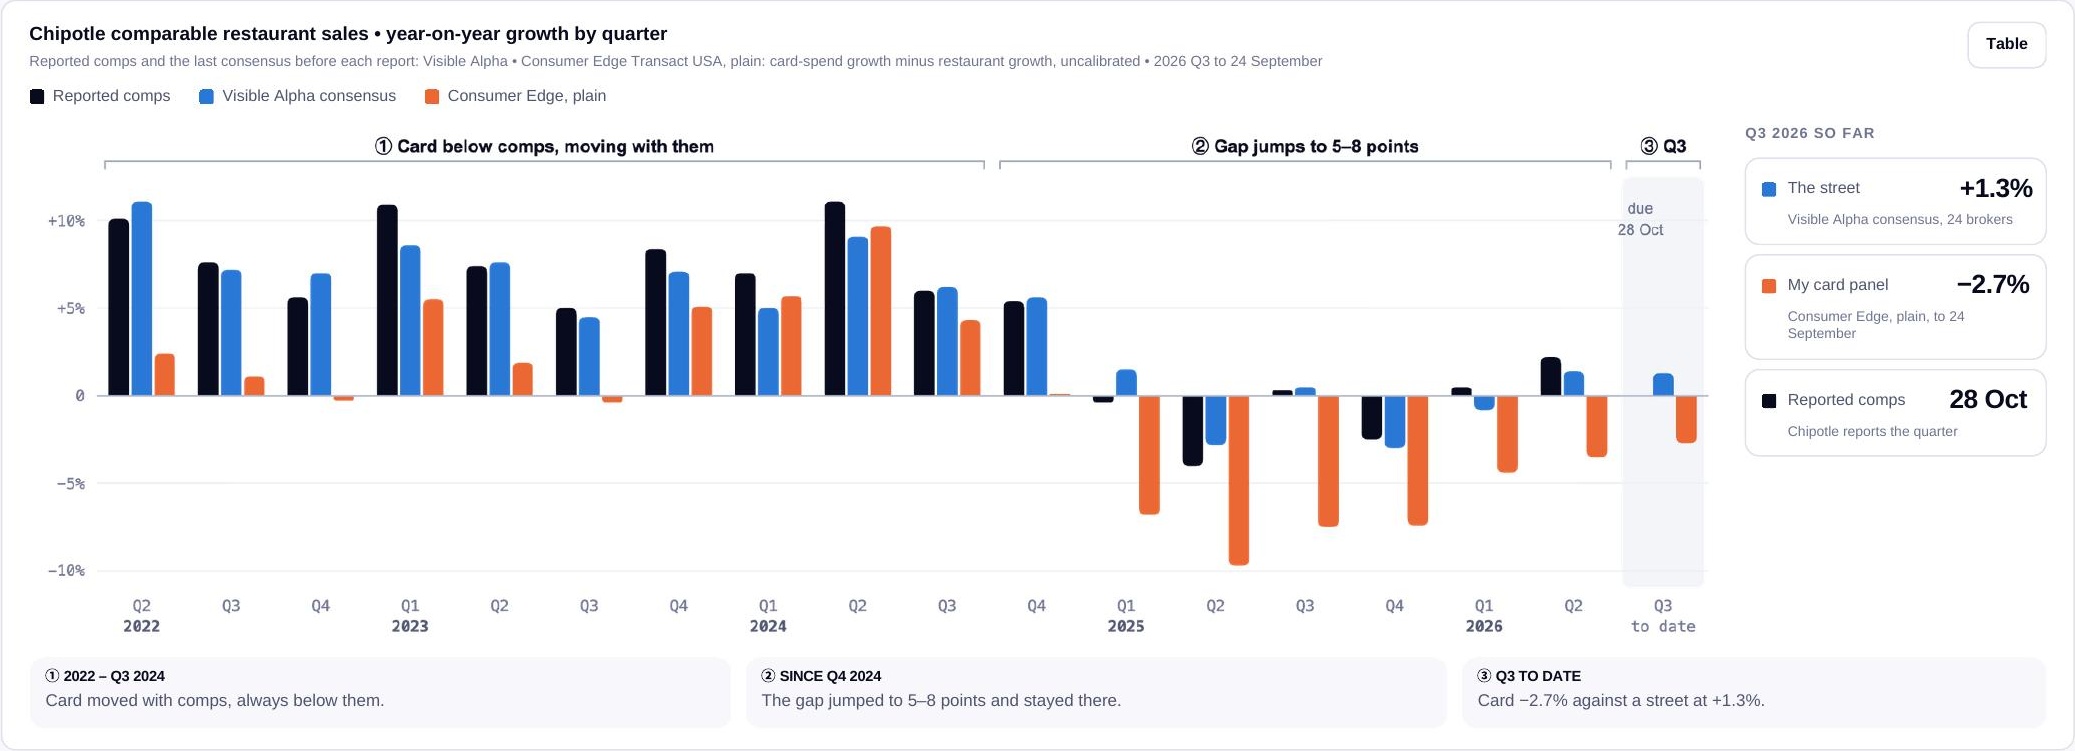
My card panel says −2.7%. The street says +1.3%.
Consumer Edge has moved with Chipotle’s comps for years, always a few points below. Since late 2024 the gap has been 5 to 8 points. This quarter, who is wrong: the street, or my panel?
The street
+1.3%
Visible Alpha consensus, 24 brokers
My card panel
−2.7%
Consumer Edge, plain, to 24 September
Reported comps
28 Oct
Chipotle reports the quarter
Hypothesis: the transactions are going somewhere else.
When someone orders through DoorDash, the card is charged by DoorDash, not Chipotle. But even the courier has to walk into the restaurant.
DoorDash orders, Q2 2026
970m
up 53% in two years
Chipotle digital share
34→38%
of sales since 2024
Card gap
5–8 pts
below reported comps since Q4 2024
Which data can see the courier?
Which foot-traffic datafeeds are in the Knowledge Graph, and how relevant are they to testing delivery orders at Chipotle?
Illustrative catalogue answer · 5 US feeds
Placer.ai
High relevance
3,900 brands and chains. Daily visits since 2017, time in store including visits under 10 minutes, and weekly same-store visits. Chipotle: one chain, about 3,400 same-store locations. Short visits capture pickups and couriers.
pass_by
Medium relevance
8,300 brands and 1.35 million individual stores. Visits since 2019 across 33,000 cities. Chipotle: 4,210 stores. No time-in-store split to isolate pickups.
Advan
Medium relevance
10,700 brands. Visits for retail and facilities at brand level. Brand-level visits only.
INRIX
Low relevance
1,000 brands. Vehicle trips ending at brand locations. Counts cars, not people walking in.
Gridwise
Context only
Eight gig platforms, including DoorDash. Driver trips and earnings since 2019. It sees the courier, not the restaurant.
For the delivery hypothesis, short visits matter. Start a Placer.ai trial.
Fund workspace · illustrative trial review
1 chain
Chipotle chain-level data
9.7 yrs
Daily visits and dwell
≈3,400
Same-store cohort
7 files
Each restates full history
SHOW TABLES IN PLACER_TRIAL;
✓ FULL_DAILY_METRICS — 104 fields
✓ SSV_WEEKLY_METRICS — 33 fields
✓ DAILY_METADATA
ASSESS CHIPOTLE (TICKER_SYMBOL = 'CMG');
No restaurant store-level rows; tickers have no exchange; some chains exclude visits under 10 minutes; recent weeks are revised. This is ordinary agent work—not Exabel Knowledge Graph.
Integrating directly: 15–30 days before any research.
There is no store matching to do: Placer delivers Chipotle as one chain. The hard part is knowing which number to use, what it measures and when it was known.
- 11–2 days
Pick one table and one publication
Seven daily files each restate history back to 2017. Sum across them and every visit counts seven times.
- 21–2 days
Separate same-store visits from all visits
All visits are up 6.6% this quarter, but Chipotle has 9% more restaurants. Same-store visits are up 3.7%.
- 33–5 days
Rebuild the comparable-store cohort
The store count is re-derived week to week and restated between files. No member list is delivered.
- 44–8 days
Decode 241 metric fields
Some chains exclude visits under 10 minutes; dwell buckets add up to more than total visits.
- 51–3 days
Map weeks to fiscal quarters
Monday–Sunday weeks straddle quarter ends; peers report on 52/53-week years.
- 65–10 days
Resolve tickers before adding peers
Tickers carry no exchange: AD is Ahold Delhaize, MC is LVMH. 6,587 company references to check.
- 7Recurring
Keep every publication
Recent weeks move up to 2 points between files.
The Knowledge Graph moment
Has this semantic work already been done?
Placer.ai Same-Store Visits Connection
Identity
ReviewedPlacer chain → Chipotle brand → Chipotle Mexican Grill, NYSE: CMG
Meaning
OverlappingSame-store visits overlap comparable transactions; they are not comps
Cohort
Vendor ruleVendor’s stores open 13+ months, re-derived weekly; no member list
Time
As knownMonday–Sunday weeks mapped to Chipotle’s quarters; every publication kept
The caveats travel with the data. Illustrative target-state Connection.
The agent writes the code. The graph supplies the bridge.
Placer trial
id · end_date
same_store_visits / _prev_year
publication_date
Maintained Connection
placer_chain_id → kg_company_id
valid_from / valid_to
measurement_contract
Fund research
kg_company_id · fiscal_quarter
va_comps_reported / _consensus
ce_card_plain
One publication at a time · the vendor’s cohort kept as delivered · weeks assigned to Chipotle’s fiscal quarters · all-visits segment confirmed · nothing fuzzy-matched.
It was my panel, not the business.
Placer same-store visits, joined through the Connection. Since mid-2024 traffic has tracked reported comps.
Foot traffic
+3.7%
Placer same-store visits, 12 weeks to 20 Sep
The street
+1.3%
Visible Alpha consensus
My card panel
−2.7%
Consumer Edge, plain
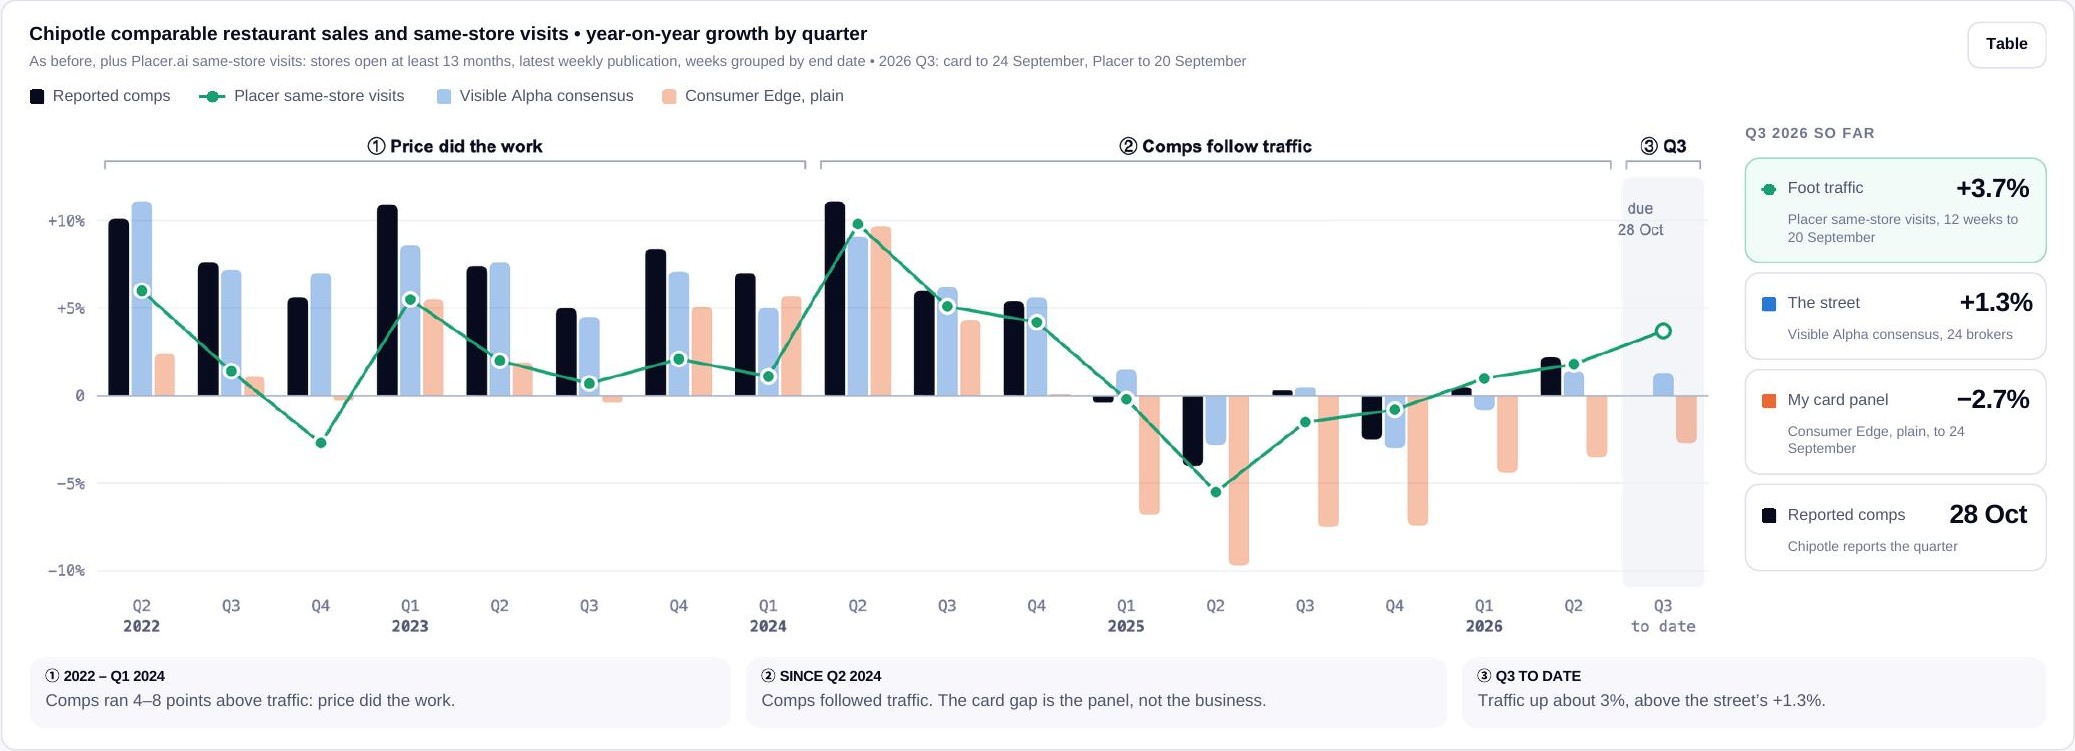
Traffic explains the level. Card explains the direction.
From research to governance
The agent prepares an approval-ready evidence package.
Dataset assessment
Coverage, history, publication and revision behaviour, limitations
Semantic integration record
Connection version, measurement contract and open vendor questions
Reproducible analysis
The comps chart, its SQL and the pinned Placer publication
Licence request
Placer.ai same-store visits for US restaurants: scope, cost and evidence
Dataset assessment, integration record, reproducible analysis and licence scope assembled for internal review. No request has been submitted.
Who captures the value?
Make integration work reusable and compounding.
Buy side
For funds
- ✓ Faster trial-to-decision cycles
- ✓ Lower integration and maintenance burden
- ✓ Honest point-in-time research
- ✓ More datasets tested with the same team
Sell side
For data vendors
- ✓ Less friction during evaluation
- ✓ Fewer repeated mapping questions
- ✓ Higher conversion and faster time to revenue
- ✓ Transparent coverage and quality feedback